Friday, August 19, 2011

Friday, August 5, 2011

Tuesday, August 2, 2011

BRICs Update: Multi-speed growth and trend dispersion

BOVESPA sitting on significant long term Support.

Russian RTS is trending higher Supported by the rising 21-Week SMA.

India's SENSEX is slowly approaching the flat Support at 18100 with a bearish 21/55-Week SMAs cross.


China's Shanghai Composite is in a long term range consolidation with a downside bias as the index is trading below all important Weekly SMAs. Critical Support lies at 2400 level.

Friday, July 29, 2011

Global Macro Update: Gold - EURUSD - Euro Stoxx 50 - 10Y Bund

Trend Channel Upper line shows 1645 as a potential target. First Support lies at the 1578 previous High in confluence with the 20-Day SMA.


EURUSD is trading right on the middle ground of the recent 1.40 - 1.46 range Supported by the converging 20 & 72-Day SMAs. Downside the 200-Day SMA holds the key at the major psychological 1.4 level.

DJ Euro Stoxx 50 Index is trending down with scope of 2599 Lower Channel trendline.


10-Year German Bund is trending up amid growing economic concerns and US and EZ Periphery Debt problems. Previous High at 131 is an obvious target for the current directional move.

Thursday, July 28, 2011

BOVESPA - Brazilian Equities in a Downtrend

Downtrend target for BOVESPA > 58000 where previous Low should act as Support.

Vale is sitting on the 20 Day SMA and 32.02 looks as short-term target where the 200-Day SMA lies.

Petrobras hits Resistance at 35.19 and goes back to base around 33 and 33.65 where the 20-Day SMA would provide Support.

ITAU Bank trend down the channel with a target at 18.85 - a confluence of old Lows and the 200 -Week SMA Support.


Thursday, May 5, 2011

Sell in May and Go Away?

S&P broke important support and technicals already signal a reversal - at least in the short term. A move below the 50-Day MA will accelerate the move.

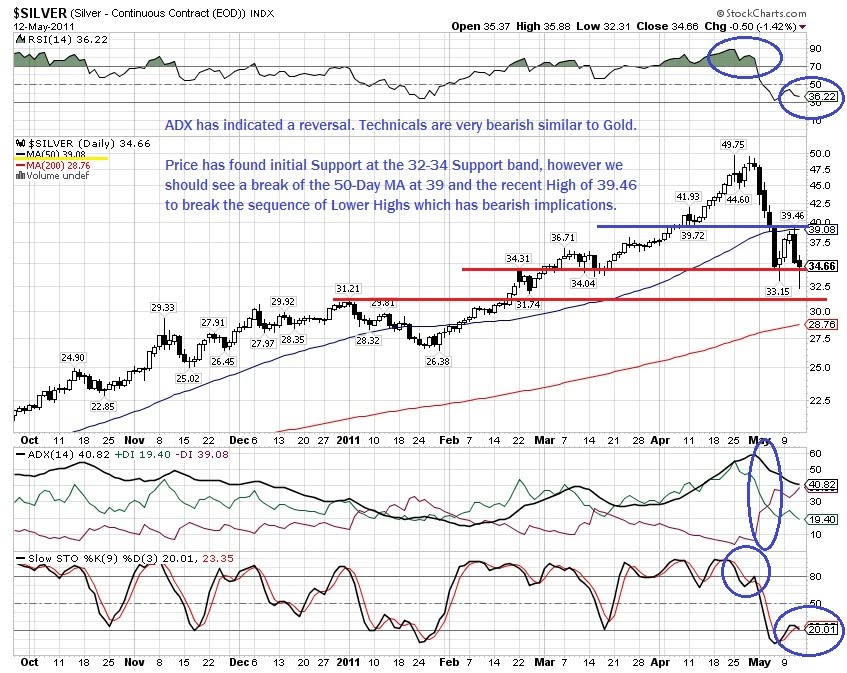
Silver is breaking painfully down towards the important area of support around 30-34 levels.
Looks like a bubble unwinding but let's see what the end of QE2 brings as inflation is still not on the radar of CBers.

As indicated in the previous Global Macro update, Copper is moving toward 408-410 area which is a 'make or break level'. Below it the 200-Day MA will hold the move, however we might see a major exodus out of commodities once a snowball effect takes place as too many players jumped on the bandwagon of the inflation theme and maybe overstayed their welcome. Let's see how Copper will trade at the 400 level.

QE2 seems to come to an end and yet again deflationary fears are rising.
Rates are dipping down towards the 3.2% Support and if broken they will target again below 3%.

Are you ready for a bounce?
It is always important to wait for a confirmation and not jump in anticipation so I'm just making this observation that the trend is already overextended and technicals are in Oversold conditions for quite some time so a reversal is highly probable. When, how much, and whether it will be a Major reversal is to be seen.

Tuesday, April 26, 2011

Global Macro Update - Asset classes consolidate after the recent moves

10-Year USTs need to fill the Gap and break out of the current ranges to initiate a decisive trend. Until ranges hold I remain cautiously monitoring the price action ahead of the end oof QE2.

Copper is consolidating inside a tight range and looks like a Descending Triangle is in the making.
It is a bit early to call a breakdown, however if we see a close below 407, Copper should slide to the next support at ~360.
On the upside the Major trendline (RED) is the important Resistance guide to price action.

Gold seems weary of the slow grinding higher and at a trendline Resistance with technicals screaming for a pullback if not Reversal.

Silver produced a large DOJI. Could be a blow-off top of just a temporary indecision.
Next Support comes around 42 and then will see which one is the case.

S&P 500 coils higher on low volume.


USD is trending inside the down channel.


Compalcency rules the market.

Thursday, April 14, 2011

EUR/USD Trend Channel suggests a move above 1.45


A simple 4H chart suggest we see some more filling the 1.44-45 range before a continuation along the trend above 1.45. My guess is the large intra-day swings we saw in the recent days were meant to shake off the weak longs and get more small fish that shorted on the move below 1.4450 on the boat before the true move above 1.45 starts.

Monday, April 11, 2011

Bollinger Bands & Slow Stochastics Trading System


Here are just exemplary Entries and Exits for a Trading System based on Bollinger Bands and Slow Stochastics.

Wednesday, March 30, 2011

US Dollar Index (DX) - A possible Falling Wedge Bullish signal in the making

USDX bounced off the important Support around 75.50 and is trading currently inside a possible Falling Wedge that could produce a Bullish signal if broken on the upside. An important level to watch for this breakout is 76.50.

30-Year UST Bond targets 117.50

Everybody awaits hints of rising rates and a bond market selloff ahead of the end of QE2.
Technicall the 30-Year UST Bond is below the pivotal 120 mark and indicators point to a further decline which is in line with the fundamental expectations of rising yields.

Stochastics entered into Oversold territory, however BBands and charts points to immediate targets around 117.50-118 before a bounce could be expected.

Small Caps continue to Outperform the S&P 500


The Russell 2000 index continues to outperform the S&P as the ratio chart shows. It usually means that large caps are fairly valued and money flows into Small Caps in search of additional alpha.

The Teflon Market - S&P and the Sector Performance

The Teflon Market as they call it on CNBC shrugged off all the bad news from Middle East and Japan and is once again in Bull mode. SPX broke above the 55-Day MA targeting the 1335/4o recent highs. Technicals remain Bullish and trend looks constructive at this stage.

Small Caps represented by Russell 2000 are outperforming the S&P and looking for new highs.

Basic Materials remains in the best performing sectors list with Precious Metals leading the rally as Silver is on a strong Bull run with immediate targets above $40.

Energy Sector along with Crude Oil making new highs underpinned the strong performance of the S&P in the midst of the recent tensions. Oil & Gas companies seem to benefit from the rising Oil prices and the fears from the Nuclear power as Uranium stocks were hit extremely hard after the Japan Earthquake.

Financials are struggling and remain below the 55-Day MA. Housing sector problems and big number of mortgages still under water seem to be a drag on the balance sheets with slow credit growth doesn't help also.

Industrials are lagging the Materials and Energy but still perform in the top tier as economic recovery goes on.

Technology is having problems below the 55-Day MA for the moment as companies still withhold from spending.

Interesting enough the Consumer sector is a raging bull here but looking a bit tired as the trend is looking a bit flat even though we see a nice pull back after the Japan earthquake hit. The QE2 loose money policy should be benefiting the consumer while it is a bit confusing as the housing sector is struggling and mortgage payments are a drag on consumption for a large part of the lower income population until the unemployment falls to levels below 6-7%.


Utilities as a traditionally defensive sector are not in vogue and actually flat for the last 6 months.


Health Care is actually in a pretty healthy position. We should monitor the political decisions for further guidance in this sector.