Tuesday, December 28, 2010

SOFIX breaks Long term Trendline Resistance


SOFIX is testing a break above the long term Trendline Resistance in confluence with a second attempt to gain hold above the 100-Day MA.

If this test is confirmed by 2 consecutive positive closes First target is the 400 psychological mark and then 442-446 area.

Thursday, December 23, 2010

Silver & Gold poised for reversal based on Trend Momentum Divergence

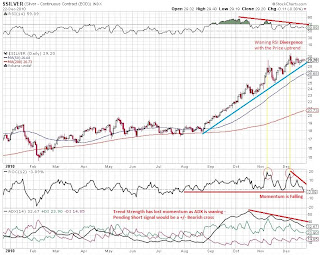
Silver had a stellar rise with a 73.5% YTD performance and still holding above the steep Uptrend line support. Momentum studies are DIVERGING with current trend and pointing to a waning strength in the move. Waiting for the pending Short signals in DMI and ROC to unfold.

Gold has performed rather bleak given all the media attention as a main inflation wealth protection vehicle reaching 26.3% YTD return.

Momentum studies are showing falling strength in the current trend and I'm watching for similar pending technical Short signals.

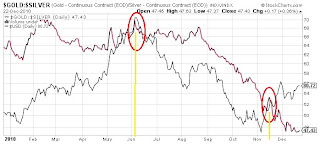
Interesting chart here is the Gold-to-Silver ratio and its relationship with the US Dollar Index.
Since June till November there was a loose positive correlation that dissipated after the FED announced its QE2 plans.

Based on this chart I would look for a bounce in the Gold/Silver ratio which would come with a strong pullback in Silver which outperformed strongly Gold since August 2010.

Wednesday, December 22, 2010

VIX near 1 year Lows - Warning of a pending trend reversals


Market extremes would favor taking the other side: Mainly going long Volatility and shorting the SPX. CBOE Put/Call Ratio is down however not at an extreme level so it might be giving a warning signal that the price moves hasn't run their courses just yet but it is time to stay alert of a trend reversal.

Momentum Divergence in GOLD: Pending Short signal


GOLD is Media's favorite anti-inflation play. Inflation expectations for 2011 are predominantly Flat as I watched a GS economist on CNBC today. So what happens in an overcrowded position?

Technically I see a Momentum Divergence. Rate of Change and RSI are ticking down while the price is consolidating with a slight upward Tilt.

ADX has been indicating a strong Trend however with +/-DIs closing the Spread it develops intoa classic Short signal based on Welles Wilders's own work.

EUR/USD sitting on crucial Long Term Support


EUR/USD is bouncing off the crucial Support area around 1.3076 (50% Fib) and the 200-Day MA at 1.3095.

It has bounced off the test of 1.30 support and now is trading off a long term trendline in confluence with the 200-DMA. For that to play out we need to see at least 2 closes above the short term 21-DMA which is tracking the current downtrend.

The medium term momentum framed by the downward trend channel however is pointing to 1.28 (61.8%) and 1.244 (76.4%) if the 200-DMA gives way decisively.

Tuesday, December 21, 2010

AMGN, Biotech firms and ETF are very Bullish


AMGN broke out above 50 & 200-Day MAs on large Volume and is heading into a solid Resistance area around 58.

Biotech ETFs are very Bullish breaking above previous Resistance levels.


The relative performance charts of AMGN to the other S&P500 Biotech constituents is pointing to Outperformers: LIFE, GENZ & BIIB.

CELG & AMGN will have to overcome strong Resistance levels and GILD is clearly struggling.

Wednesday, December 15, 2010

EURUSD equality amidst 1.3440 - 1.3230 range

Daily Chart makes for a downward trend channel so far.

Weekly Chart shows a giant Wedge in the making but the last top around 1.42 failed to test the Resistance Trend line so it adds an overall bearish sentiment to the big picture.

Price action is struggling below all major MAs (21 - 55 - 144) and it implies that if the 50% Fibonacci level (1.3433) of the last move is not regained decisively (which is a confluence Resistance area along with the 21-Week MA at 1.3372) a test of the latest base around 1.26 is following.


Monthly chart shows the significance of the 144-Month MA which held the last move down to 1.19 which coincided with the 50% Fib retracement.

Friday, December 3, 2010

Commodity Groups & S&P Sector ETFs' Performance YTD


Agriculture has outperformed with 38% YTD and PMs are catching up with 29%.

Energy and Industrial Metals are performing rather bleak in the 8-10% brackets.


Best performing sectors have been the Consumer Discretionary (22%) and Industrials (14%).

Energy and Materials are in the lower 5-6% bracket.

Healthcare & Financials are struggling with 7-8% Negative performance.

Business Cycles & Sector Rotation - Selection of charts

Source: stockcharts.com


Source: D.W. Dony and Associates Inc.


Source: Standard and Poor's

Source: NBER Research Paper

Source: John Veitch, CFA

_______________________________________

Bond Portfolio Allocation


Source: PIMCO educational section / BofA Merrill Lynch, JPMorgan, NBER