Friday, February 26, 2010

Buying value - long USD/JPY 89.00


USD/YEN is range trade with balance point at 90.66 with 88.54 - 92 range ends..

Long 89.20 with 88.76 stop.

Deflation persists in Japan... seems the YEN mountains of debt didn't work in he last 20 years. Now we are about to see how the mountains of USD, EUR, GBP and CNY debt will mange to get the global economy back on track if it will in he present decade.

Thursday, February 25, 2010

Buying Key Reversal in USD/CAD for 1.0788 (200-DMA)


Buying USD/CAD at 1.0569 with a 1.0513 Stop (55-DMA).
Target is the 200-DMA at 1.0788.

We saw a Key Reversal on Feb 23 and today we are breaking through the 21-DA at 1.0571 with a 2-nd high high that favors holding a long position.

SOFIX Trend line Support broken down


Here's an updated chart of SOFIX.

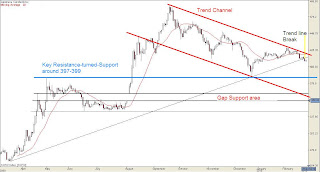
The trendline Support that was mentioned last week didn't hold and there is a close lower that puts attention to the downside scenario that is laid out on the present chart.

SOFIX is trading currently in a Downtrend Channel marked with Red.

The most important balance point is roughly in the 380 zone as it is 50% of 515-250 range so far.
The previous Resistance now turned Support at 397-399 is the first level to be tested if the Trendline break is sustained this week. The testimony of Ben Bernanke seemed to please the US stock markets and Crude finished on the high of the day which by all means risk is turning back on the table with the re-affirmation of the low rates to be kept for considerable time.

That actually is puzzling as it must favor all markets. There is however the idea of the divergence trade as the liquidity in the Developed markets pushes all asset class prices and while US entered first in the Global Financial Crisis they are the first to emerge from it with repaired balance sheets and faster deleveraging - a process that lags in the Emerging Markets and especially in peripheral markets like SOFIX.

Tight fiscal and especially the fixed monetary policy slow down the deleveraging process of investors and fresh money doesn't flow in consumption and/or investment but to replenish the consumer balance sheets. Or that is just another convenient explanation.

Selling the Sterling Short


Here are a few variations of graphical representation of trend and range on the Daily timeframe.

It is interesting if we are not trading into a Wedge formation which would actually Bullish implication.

Given the larger Range (marked by the White trend lines) we are trading below the previous Support not turned Resistance around 1.55 level.

...................................................................................


I sold the GBP/USD at 1.5409 with a 1.5466 stop.

Once in position one should be checking if he's not right.
Weekly GBP charts and wonder what is keeping it from falling in the abyss..

previous week's low a 1.5345 is a magnet and all techs point lower - Bollinger Bands are starting to expand and that signals acceleration..

my first target is 1.52, however given previous week's range it is possible if we see acceleration to hit 1.51 - 1.5050 lows..

today we made 2-nd lower low and it logically the 1.5345 low comes in focus.

Sunday, February 21, 2010

Legendary traders Dennis Gartman & Linda Raschke on Trading


Dennis Gartman on managing Hot/Cold streaks and Keeping it simple:


----------------------------------------

Dennis Gartman on his trading rules:


------------------------------------

Linda Raschke - Plan your trades, Learn the Essentials:

USD/CAD trend channels and Consolidation formation


USD/CAD trend channels on Daily chart:

which one is correct?

my take is with the Marubozu last Friday and close at the low under 1.04 1.0250 opens as first target and my take is we are trading into the Faster trend channel..


Here is an interesting formation - if it closed below 1.0380 right away it goes fast down to 1.0330 before a bounce - otherwise we have to overcome 1.0452 which is a central balance point inside the triangle pattern unfolding.

Saturday, February 20, 2010

Dickson G. Watts ‘Speculation As A Fine Art’ – A Speculator’s Essential Qualities

Dickson G. Watts was the president of the New York Cotton Exchange from 1878 to 1880 and that the last 85 years (that’s a while back) have changed a lot of things, but the rules of speculation set forth by Mr. Watts are still very effective in today’s market.

His list of ‘Essential Qualities of the Speculator’ and ‘Laws Absolute” show the timeless value of his insight:

1. Self-Reliance. A man must think for himself,
must follow his own convictions. George
MacDonald says: “A man cannot have another
man’s ideas any more than he can another
man’s soul or another man’s body.” Self-trust
is the foundation of successful effort.

2. Judgment. That equipoise, that nice
adjustment of the faculties one to the other,
which is called good judgment, is an essential
to the speculator.

3. Courage. That is, confidence to act on the
decisions of the mind. In speculation there is
value in Mirabeau’s dictum: “Be bold, still be
bold; always be bold.”

4. Prudence. The power of measuring the
danger, together with a certain alertness and
watchfulness, is very important. There should be
a balance of these two, Prudence and Courage;
Prudence in contemplation, Courage in execution.
Lord Bacon says: “In meditation all dangers
should be seen; in execution one, unless very formidable.”
Connected with these qualities,
properly an outgrowth of them, is a third, viz:
promptness. The mind convinced, the act should
follow. In the words of Macbeth; “Henceforth the
very firstlings of my heart shall be the firstlings
of my hand.” Think, act, promptly.

5. Pliability. The ability to change an opinion,
the power of revision. “He who observes,”
says Emerson, “and observes again, is always
formidable.”

The qualifications named are necessary to the
makeup of a speculator, but they must be in well-balanced
combination. A deficiency or an overplus of one
quality will destroy the effectiveness of all. The possession
of such faculties, in a proper adjustment is, of
course, uncommon. In speculation, as in life, few succeed,
many fail.

These are his ‘Laws Absolute’:

1. Never Overtrade. To take an interest larger than
the capital justifies is to invite disaster. With such an
interest a fluctuation in the market unnerves the
operator, and his judgment becomes worthless.

2. Never “Double Up”; that is, never completely and
at once reverse a position. Being “long,” for instance,
do not “sell out” and go as much “short.” This may
occasionally succeed, but is very hazardous, for should
the market begin again to advance, the mind reverts
to its original opinion and the speculator “covers up”
and “goes long” again. Should this last change be
wrong, complete demoralization ensues. The change
in the original position should have been made moderately,
cautiously, thus keeping the judgment clear
and preserving the balance of the mind.

3. “Run Quickly,” or not at all; that is to say, act
promptly at the first approach of danger, but failing
to do this until others see the danger, hold on or close
out part of the “interest.”

4. Another rule is, when doubtful, reduce the amount
of the interest
; for either the mind is not satisfied with
the position taken, or the interest is too large for
safety. One man told another that he could not sleep
on account of his position in the market; his friend
judiciously and laconically replied: “Sell down to a
sleeping point.”

Dennis Gartman: "Never average a loser!"

Dennis Gartman - 'Never , ever, ever add to a losing position!'


Dennis Garman: 'Keep it simple!"

http://www.moneyshow.com/video/video.asp?wid=FD1A59A90F8540F494858E453E31F7517&t=4


SOFIX - Trend Channel


The major Bulgarian Stock Exchange index - SOFIX is developing an interesting trend channel.

Trendline support has been tested this week and while the index is looking vulnerable to a further plunge there is also the alternative case of the Support holding and that in sync with the global risk appetite seen in all asset classes this week following the FED's rate hike.

There is an increasing number of signs that the inflationary trade is actually in progress with treasury yields creeping higher while bond vigilantes are selling US bonds to punish the huge deficits and low yields paid - case in point USTreasury 10-Year Note gapped and closed even lower today. You can check in the blog my call on the Bond Selloff from Feb 04.

SOFIX has a critical Support level at 399/400 level as shown on the chart and the Gap support lower at 360 is a level one wouldn't want to see broken for it might signal a test of 2009 lows.

While I'd like to see the channel bottom line holding another bullish sign is the classic 20 x 50 Day MA Golden cross. RSI is slightly negative and MACD is coiling in a pattern similar to the previous 2 times the upmove started as marked.

Technical observations just help develop a scenario and define risk points - next week will see if the current setup will prove correct or a failure of the trend line support will move focus on the 400 important level.

Friday, February 19, 2010

GBP/JPY Bear Flag?


Bear Flag in progress?

Upside 21-DMA at 142.76 is first test - then 144.

Below today's low at 140.84 open way to 13X.XX targets.

CAD/JPY trend channel


Interesting 4-Hour YEN cross chart here:

Trend channel has signalled a temporary top and now it rests on the short term MA (13) to hold or 87 level comes in focus.

Another level to watch is the 55-MA on Hourly - 1.87.15 hat held the trend last week and will signal more weakness to the USD/CAD pair as it is under pressure around 1.0519 the 55-DMA on Daily charts.

Crude Oil gives bullish signs


Daily chart says it all:

RSI trending up.

DI & MACD both gave bullish crossovers.

Since the test of the 200-DMA at $68 Crude is 12% and solidly moving in a tight trend channel.

I included an interesting trendline which however gives a warning signal. I will be looking for a close above it for a confirmation of the Bullish scenario.

US Treasury Bonds Selloff - follow-up call


I'm happy I made that call right on top of the market and it did selloff after it. I didn't have position so it is only an intellectual satisfaction with my analysis.

After yesterday FED raised the Fed borrowing window to 0.75 bp it makes sense to think on the aggregate intelligence of the market - seems markets were anticipating that move so they started creeping higher 2 weeks prior to the actual news was released.


2 / 10-year bond spreads are signalling a possible steepening which is bullish for the economy.

While on dailies the moves are pretty rangy the Weeklies have strong signals on technical indicators as well as inside the trending channel that the spreads is moving toward steepening.


10-year UST Note yiled bounced off the 3.60% support and is moving higher with first target/resistance around 3.85/89.


10-year UST Note has an immediate target around 116.90 with further focus on 116.50.


Thursday, February 18, 2010

T R E N D

EUR/USD since Dec 2009 is in trend.
here's the hindsight 'wisdom':

1.51 > 1.35 = 1600 points with only a slight bear flag consolidation between the 2 trend legs.

legendary traders like Soros say 'in the end only trend-followers survive' and Ed Seykota also holds this view with a great attention to holding to trend positions and especially against the daytrading..
...................................

now my personal experience with trading with the prevailing trend and going for the 'easy' contra trades is that when trading along the strong /trend side - trades usually unfold easy and I'm quick to take profit and leave a big part of the move...

then I make some in contra trades but they usually are nerve consuming - need quickly to take profit since the reversals are very fast and might wipe the whole profit in 1to 4 hours bar and one has to be smart in scaling-in.
.....

trouble for me has been I'd make some profits in congestions as with contra trades it's easy to pick a side and enter with tight stop beyond the range end - that however is tricky as I went 4 times yesty and got stopped every time since I was going against the 'freight train' - another popular adage..

the problem with trading the prevailing trend/strong side is when the move has begun most are uneasy to jump as the risk is hard to define and one might be jumping in the end of leg/move.
-------------
it's not an easy task but however I'd make this extra effort and will focus now exclusively in picking my spot in trading with the prevailing trends and will resist in going for contra trades - I write it here as a reminder for my personal decision.

Wednesday, February 17, 2010

Markets in a state of Trend - ETF snapshot

Crude oil spikes higher above the 50-DMA and the current range bound trading prevails.
Looking at the futures if we take out $78 then $84 comes in focus - the bounce off $70 level was quick and it leaves me watching the price asking myself if this is the next leg up or squeezing the weak shorts.


iShares iBoxx $ Invest Grade Corp Bond - Yields are historically low and the Diamond top pattern confirms in my view a possible selloff in corporate bonds. At some point bond vigilantes will come out and start punishing the bond issuers for the huge debt accrued and for the low returns on its unproportionate risk.


SPDR Barclays Capital High Yield Bond - Junk bonds broke the uptrend and I assume it confirms the scenario of rising yields already starting to happen.


US Treasury bonds are trending down - another confirmation that the inflationary trade and rising yields is actually in progress.


PowerShares DB Agriculture - it looks like an equilibrium right at the 200-DMA and a the center of the range channel. Let's see if 50-DMA holds but still we need to break away from this channel for any meaningful trend to be confirmed.


Silver is developing a large symmetrical triangle pattern. The bounce higher will meet the tough resistance at $16.


Gold uptrend hasn't been damaged so far by the liquidations in the last 2 weeks. The Bullish wedge confirms continuation so far.


ELEMENTS Rogers Intl Commodity Metal ETN - 50-DMA is pivotal to the present development. So far the 200-DMA held the plunge and I'd like to see how Metals will fare around the present resistance level.


S&P - "keep doing until no longer works"?


Just ow resilient are the Emerging Markets to the local financial crises like Dubai and Greece? Keeping the uptrend intact and developing into expanding triangle EEM will also need to take out the 50-DMA to keep its move. A failure puts again the 200-DMA support in focus.


US Dollar is correcting but uptrend is still intact.


Saturday, February 6, 2010

ED SEYKOTA - 10 RULES FOR POSITION SIZING


Ten rules for position sizing:

1. Bet high enough to make meaningful profits when you win.

2. Bet low enough so you are ok financially and psychologically when you lose.

3. If (1) and (2) don't overlap, don't trade.

4. Don't go adding a bunch of rules that don't work, just so you have ten rules.

Thursday, February 4, 2010

10-Year US Treasury Notes - Sell!


UST 2/10 Year bond spreads are further flattening which usually has bearish implications for the economy.


10-Year Yields are at an important Resistance turned Support above 3.60%.

Trend is supported by the 50-DMA, however the reversal pattern suggests further downside is possible.


10-Year UST Notes are a Sell now that they hit the central balance point of the last 2 swings.

Trading below the 50 & 200-DMAs with falling RSI and MACD about to give bearish crossover Notes are a sell until we see a close above 118.

10-Year yields bounced off the former Resistance turned Support at 3.60 and are heading for the recent 3.85 highs.