Monday, September 28, 2009

Japanese Governemnt Bonds - Yen Debt Bubble?


Here is a Monthly chart of the JGB performance.

Barron's magazine ran a story this week, which made the case the Japanese economy is a ticking debt time bomb (maybe the leader of a pack of time bombs across the industrialized world). Total population in Japan is falling fast, and falling even faster is the working age population to support Japan's massive debt to GDP ratio, measured officially at around 217%, that compares to 81.2% for the US and an average of 72.5% for the G-20 nations, according to Barron's. (blackswantrading.com/)

Interesting to me is how is it possible to maintain a debt to GBP ratio over 200% and still manage to market your massive debt. the chart shows that JGBs are in the 128 - 142 range for the last 10 years and still remain strong with all time low yields..

Sunday, September 20, 2009

UUP‎ - PowerShares DB US Dollar Index Bullish (NYSE)‎ > REVERSAL


Reversal in the USD Index trend?

Check the UUP - USDX Bullish Fund has closed Friday trading with recorg high Volume!

Interesting for me was to check the distance from the 21-Day MA.

You would find interesting cyclical correlation noted on the Daily chart. If the noted cyclical bottoms signalled by the confluence of both the RSI (14) and Wilder's DMI (14) are to be trusted we have seen ay least the short term bottom in USD Index.

The reversal should be confirmed by the record volume on the Friday closing.

Friday, September 18, 2009

USD Index ($USD) at 76 level - long term line in the sand


USD Index is trading close to the 76 level which is often described as Line in the Sand.

Another interesting technical fact is the Falling Wedge Pattern which has bullish implications - only given the the current lows hold!

EUR/USD rejected at 1.4766


Here is the EUR/USD daily Channel (parallel lines). After making a top at 1.4766 yesterday - price was rejected 4 times off the 1.4750 level - hence the liquidation seems to start.

Daily chart shows the Channel top was probed higher at 1.4766 bu it held the real body of yesterday's surge.


To put the short term price action - the 4-hour chart shows the EUR/USD still trading in the channel it has been trading inside the last 2 weeks since the breakout above the 1.4446 level.

4-Hour Channel bottom comes around 1.4644 - a level to watch for Support or breakdown.

Hourly chart reminds me previous similar cases of liquidation markets with those long drops and no retrace. Currently the Hourly 100-MA at 1.4667 holds and the 200-MA at 1.46 is the target if it is a truly liquidation day.

Thursday, September 17, 2009

AUD/USD - too much too high?


So if we look at the market with the assumption that easy and most money are made in trading trends - here is the picture:

1. Weekly - We have spent all 2009 till present in one big rally from 0.63 to nearly 0.88 - with only one Bull Flag consolidation in June..
the pair trades high above the 61.8 fib and he target seems to be the 78.6 at 0.9029..

2. Daily - the most notable pattern is that Bull Flag consolidation channel that took the whole month of June to form and the breakout occured in July above 0.81

the 3 horizontal levels are the stairway pattern of ranges:
0.8280 was a pivotal level and a solid support till in start of September the Resistance at 0.85 was broken.

then the range established itself a notch higher between the 0.85 - 0.87 - this level was broken yesterday along with new highs in Gold and Silver.

3. 4-hour chart - we see this 0.85-0.87 range and the rounded top formed since the break of 0.87...
------------------
so what's the point of this story:
if trading short term - then we have to see if support at 0.8667 which is confluence of previous range top now turned support and the 21-MA which is pivotal to the present time frame. then we either rotate back inside the 85087 range or take off higher.

my take is we have some time out since this can't go on forever.

GBP/USD Harmonic Balance Range


GBP/USD Daily chart is a little puzzle for me and that's why I'm challenged to rationalize the current price action.

The Pound has spent last 3.5 months in roughly the 1.61 - 1.67 range with a down overshoot to 1.58 In June and Up-Overshoot to 1.70 in Aug.

So this makes a balanced price distribution in a 600-pip range (1.61 - 1.67) with 2 equal overshoots which also equal 1/2 of the middle range (300 pips: 1.58-1.61 & 1.67-1.70).
NOTE: Here is a rough range figures and this is an attempt to analyze the distribution of the price within the ranges which I'm just experimenting with.

So right now we are standing at a pivotal area defined by the 21-Day MVA at 1.6416.

So Since today we have a small inside, tight range day - that means tomorrow we either accelerate or retrace and resume uptrend. I can see these 2 scenarios:

1. Bearish case:
- the 21 / 55 Day MVA Dead Cross
- 09/11 was a Grave stone Doji + Rejection off the Upper range area + confirmed by 2 consecutive down days.
- trigger for an acceleration will be a breach and close below the 55 DMA/1.6450 & 21 DMA/1.6416

2. Bullish case
- since Start of September we are in a sequence of higher highs / lows
- the last 3 down days actually made a neat 50% retracement of the 1.6114 - 1.6740 move (50%=1.6426)
- today's Low is higher than yesterday's and above the 21-DMA
- rising 89-DMA at 1.6349 - held the downtrend and the reversal in the start of this month - now it runs above the 09/07-08 Lows at 1.6321/25
......................................
However I feel again like I'm trying to pick a side instead of objectively analyzing the chart. One clue to the puzzle might be the outright break above the 200-DMA in EUR/GBP which promises relative weakness in GBP compared to EUR.

this means if EUR/USD now pauses at 1.4735 and retraces - then the GBP/USD will have an even steeper decline.
However if Euro accelerates thru resistance the pound will also surge but lagging.
On Crosses GBP/CHF is lingering right at the 200-DMA and GBP/JPY is developing today a big Doji pivoting around the Sept 01/02 Lows which might be good for a bounce.

Wednesday, September 16, 2009

EUR/USD meets the T/L Resistance at 1.4735


Here are some Sequential facts:
> from the base at 1.42 we have 530 pips trend with 9 Up days and only 2 down tight range days.

some evidence from March '09 show we had a powerful move of 10 up days with only 2 down days in the basing structure.

what is interesting to me is we either bounce off the current Channel top at 1.4735 or we accelerate to meet the projected top of the bigger Channel which is at 1.52 right now..

NOTE: the large/white upper T/L - if you connect March _ June highs - there is a trendline Resistance which if projected backwards just goes perfectly to the Jan high at 1.3328 - the only problem is the lower T/L..
- since I try to chart an Uptrend - then I must be focused on the Supportive T/L and the Large/White 'channel' has some flaws - like my call for a straight 500pip move to 1.52.

Certainly calling another 500 pip rally is bold but I get clue from the Dec'08 squeeze and the March '09 sharp up-move.

WHY? --- well I gather from recent trading themes that market is geared to seize the USD carry theme.

So if we step on that assumption then any rise in risk appetite should see USD selling --- from the pieces of analysis i read the USD is now much better funding ccy than JPY or CHF - so what was Pavlov's dog reflex to sell JPY before is turning to USD selling.

Checking on the markets we have a massive moves to new highs in Gold (1022), Silver (17.45), Copper (294 - just shy of 298 highs), S&P500 up 1.30% to 1066 -- so we have stocks and commodities rally and USD depreciation hedge in Gold and Silver at the same time.
----------------------------
I should check twice since in trading this same impatience has cost me a lot just for trying to fit my trading with some occasional 'bright' idea instead of double checking and waiting for a respective confirmation.

EUR/USD acceleration for a measured target 1.52?


..........
Weekly chart:
1. That T/L from Sept'08 highs got broken last week
2. We HAVE NOT CLOSED below 10-Week MA since March 15, 2009
3. The Upper Bollinger Band is right now at 1.4644 - so it means this week we either retrace inside BBands and test the Support around 1.44 or accelerate straight up.
..............
Daily chart:
1. While watching the consolidation channel (yellow lines) I didn't see the Big trend Channel (solid white) -- EUR/USD bounced off without even touching the base around 1.42..

2. So 1.4720 is a pretty significant point - it is a confluence of Resistance - Dec'08 High and the Consolidation channel top (1.4740 approximately)...

Now the last 5 days developed much like a Flag pattern (as visible on the 4-hour chart) - but it can also be seen as an Expanding Triangle which has Continuational implication.

So a measured move that passed the length of the Consolidation channel in 8 days from 1.42 to 1.47 is 500 Pips.

Now if we assume we are in trend mode and break tomorrow 1.4720/40 cluster of resistance - then a new measure of the next 500 pips comes comfortably at 1.52 -- which is the Projected Top of the Big trend channel as seen on the Daily chart.
....
Certainly it looks like a long shot at the moment and I'm interested where we'll see some reaction.

on a side note the S&P, Gold, Silver all made new highs - the Limit up moves in Corn & Soybeans all at one moment certainly mean something.

USD Index ($USD) - 7 Consecutive Down days - what if we have a surprise rally?


USD index is mostly a mirror image of the EUR and cousins - however it was interesting for me to try to put it in a perspective. Here is an interesting tech picture:

1. Slow Stochastics and Wilder's DMI both show downtrend continuation.

2. USD Index has spent already 6 down days below the significant chart point -> Dec'08 Low around 77.65.

3. Now what is interesting to me are those 2 facts:

a> at the start of Sept'09 USDX didn't even touch the projected Channel top but dropped straight through 78 and the 77.50/60 lows.

b> however I can't really imagine a drop where the Channel bottom is projecting... not that fast at least

> also please note that this is already the 7-th down day and I couldn't find any such sequence in the last year to date period.

> this corresponds to the slow grind process in the EUR/USD which makes every day marginal new highs - and this is also called "Labored Move".

So while I don't want any more to call tops and bottoms, however while the important 76 isn't even probed so far and we have 7 consecutive down days there is a mighty chance for a counter rally to the surprise of the late USD bears.


Tuesday, September 15, 2009

Corn & Soybeans Limit UP Day


.......................

......................
CHICAGO (Reuters) - U.S. corn prices surged 9.4 percent on Tuesday, rising the maximum daily trading limit after forecasts called for a frost in the U.S. Midwest next week that could harm the maturing crop, traders said.

CBOT corn futures for December delivery rose the daily trading limit of 30 cents to $3.47-3/4 per bushel, the highest level in more than a month. Corn for March and May delivery also went limit up.

CBOT November soybeans rose nearly 7 percent to as high as $9.77-3/4. Soymeal futures for delivery through March rose the rose the daily trading limit of $20 per ton.

U.S. crops have thrived this summer, and the U.S. Department of Agriculture last week projected a record harvest of soybeans and a near-record corn crop.

________________________

I has always been fascinated by the huge volatility and those lock limit price moves - here is one to rebebmer.

EUR/USD Channel top projected around 1.4740


Interesting confluence of Resistance on the Daily chart:
1. Former top at 1.4720
2. Uptrend Channel top projected around 1.4740
.......

Uptrend is firmly manifested my the steep slope of the 21-Day MA & 200-Day MA..

EUR/GBP Up-trend meets the 200-Day MA


as noted before EUR/GBP Weekly chart probes T/L resistance.

Daily chart is a little puzzle:
> Up-trend breakout of the Dec'08 - March'09 tops Trendline

> break of the 0.8866/69 highs from May - June'09
(blue vertical resistance line)

> the move bounced comfortably off the 21-Day MA (now at 0.8747)
...........
> Resistance presently is the 200-Day MA at 0.8885

so Price is confined right now between the 21 and 200-Day MAs - mu assumption is it either closes today above 200dma and tomorrow just takes off into 0.89/0.90...
--- the other option it retraces to test the support at the former T/L resistance around 0.8820/40 and then resumes the run up..
...............
any close below 0.8750 cancels the current uptrend scenario.

EUR/GBP Probes Weekly Trenline Resistance


EUR/GBP is breaking the Resistance Trendline on Weekly Charts.

Also the former Resistance trendline in 0.81-82 turned Support in 0.8380/90.

The pair is making higher high/lows while trading above its 21-Week MA..

Interesting to see if the consolidation around 0.84-0.86 was a base for a trend higher.

Sunday, September 13, 2009

GOLD Monthly historical chart of interest


I did some basic research with quite interesting results:

> '79 - '80 - it took 2 years for a 460% rally from $190 to $875

> then 3 years ('80-'82) = 86% decline in value, which resulted in 24 years of $250 range.

The $250 range represents 36% of the whole $190 > $875 move which happened in only 2 years - '79-'80.
.........................................

Now from 2006 break of the $500 level, in 3 years we had 200% range extension
(500 ->1000 = 200% of the $250, 24-year range)

What is most probable to happen after we saw 100% appreciation in 3 years (500 > 1000 USD)?
In scope of these historical events it seems it might go up easily another 500 USD.

NOTE: However let's not forget that it took already 9 years (2001 > 2009) for a 400% rally from $250 to $1033.

GOLD Weekly Up-trend


Gold on the Weekly chart is showing all the signs of a strong up-trend:
> Vertically made a Marginal New High above Feb Highs
> Resistance T/L from 1033 High is broken with a close above!
> After he 21/50 Week-MA Golden Cross the 21 is acting as support and is sloping upward to suggest an Acceleration
> Clear Channel trending
> 200-Week MA up sloping
> RSI & MACD corroborating all of the above
> DMI buy signal is now signalling acceleration of trend strength

Friday, September 11, 2009

Crude Oil - Support turned Resistance

USD Index trending down - Always go with the trend!


Here is a Daily USD Index chart with an interesting cyclical points which imply the weakness is here to stay.

Pls note the Parallel Channel (Blue lines) has been breached 2 days in a row with a clear target sub 76..

The slope of the 21-Day MA only adds up to Acceleration of the present trend.
.................................................................


Here is a Weekly USDX chart.

The present pattern shapes up as a Falling Wedge (Which typically has Bullish implications) but it depends on if the week will close below the T/L as it is breaking it to the downside at present.

Lower there is another Low just below 76 and then 74.20/30.
..........
On a side note just psychologically interesting that this has been trending for a long time and people should have been conditioned for the USD weakness - in spite there is constant 'fight' against the flow. I am extremely interested to watch what the mass 'contrarian' thought will have as final resolution.

Wednesday, September 9, 2009

EUR/USD False Breakout?


Daily chart shows the consolidation channel's top range being challenged.

Technically it looks like a Ascending Wedge which usually resolves into a steep drop. With the non-convincing price action of Gold around the $1000 figure it hints we might have a false breakout. However I remain on watch for what goes next:

it's either 1.4550 or 1.1.4350 that would give direction.
_ _ _ _ _ _ _ _ _ _ _ _ _ _ _


here is an alternative charting view - a parallel channel with projected Resistance top around 1.46. However I keep in mind the market made 3 Up-days and might need a recess. Again a break of 1.4550 or 1.4350 would clear this case.

Friday, September 4, 2009

COPPER runs into tough Resistance


Monthly COPPER chart.

I post it as I see a similarity in the Wedge formation that was completed by a steep drop.

The other more pertaining to the present moment observation is that the last Month has just filled in the September 2008 Gap and now it is possible that there is an Island Reversal since it runs into tough Resistance (end of 2007 lows and the 2008 gap).

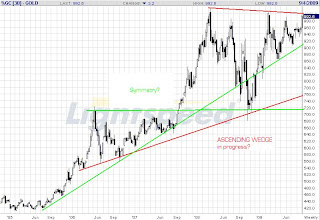
GOLD in breakout or Ascending Wedge in process?


Here is a Weekly GOLD chart.

In RED is the possible Ascending Wedge formation. This outcome implies a steep fall once the supports gives in.

In Green is the observed Symmetry of the move from $420 -> $720. The the Breakout and the current Range $720 <-> $1000.

It Reminds me actually a skewed variation of a Bearish Bow Tie formation.

Wednesday, September 2, 2009

US Dollar Index charts


....
A few hints about the direction of the USD index are:
- DMI is about to give a buy signal
- RSI pops above mid level

However the 78 - 79 range is still intact so the price is neutral atm and pivoting 2 weeks around the middle of the 78/79 range as seen on the chart..

To me it looks like bottoming and however in this business you always need confirmation before you commit - otherwise its called gambling - so I would like to see a 20&50 Day MAs reach a Golden Cross which most likely would coincide with a breakout above the Short term Resistance around 79.50/60 -- it's obvious how nicely the 50-Day MA held the rise 2 weeks ago - so let's watch for the next test.
....

....
USDX Monthly chart is exremely interesting to me as I have no experience trading off such Long term time frames.
My first impression is that until the price regains the 80/81 area it is still bearish as it is lingering below the central range area as marked by the horisontal channel lines.
So it is a game of patience as to see if last month's candlestick might be taken for a near-Doji and might be a signal for reversal.
A break & close below 78 negates this scenario.

Natural Gas Trend

....
Daily chart suggests exhaustion of the current trend. It however looks very neat and orderly and I assume there might be some acceleration at this stage.
....


....
The Monthly chart however gives a clue of the potential of this trend move.

As it is at 7-year lows there is enough reason to me that it might test pre 2002 sub $2.00 lows.