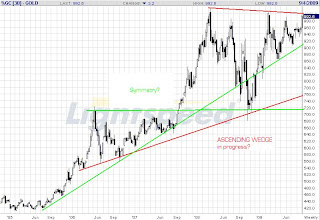
Here is a Weekly GOLD chart.
In RED is the possible Ascending Wedge formation. This outcome implies a steep fall once the supports gives in.
In Green is the observed Symmetry of the move from $420 -> $720. The the Breakout and the current Range $720 <-> $1000.
It Reminds me actually a skewed variation of a Bearish Bow Tie formation.

No comments:
Post a Comment