Friday, October 8, 2010

Shanghai Composite - Momentum Buy!


China is on the move up - trend momentum is rising and RSI is converging. Once 2700 is cleared we target the 200-DMA.

Wednesday, September 22, 2010

EUR/USD Fibonacci levels to watch


Well who says Fibs don't work? LOL.
EUR/USD at 1.26 nicely bounced off the 50% level (1.1869 - 1.3344).

Now that we have breakout of the 1.3344 high we focus on 1.35 which is the 50% of the bigger 1.50 - 1.186 move.

Tuesday, September 14, 2010

Currencies Breakout versus the US Dollar

AUD/USD broke above psychological 0.94. Now in uncharted territory we can't really force a target - the Channel top gives a notional 0.9550 cap on the breakout move.

EUR/USD broke above 1.2920 and trading above 1.30 now. Trendline comes in 1.3050 but significant focus of the market will be attracted by the flat Resistance converging with the 200-Day MA at 1.3286.


GBP/USD has been a weak link especially on the crosses reflecting the global imbalances like GBPAUD and GBPCAD.

GBP/USD is trading above the 1.55 BOX top with immediate targets at 1.5580 and 1.57.

Monday, September 13, 2010

Volatility is making new lows but Bond Yields are turning

10-Year Note is making Bullish Engulfing pattern with low at the 50-DMA Support.
So we look for confirmation on the upside.

10-Year Yield made a Bearish Engulfment right at the 50-DMA Resistance.
ROC is in overbought territory but RSI is just signalling a bullish trend so a confirmation on the downside is needed as we saw the same situation above in the underlying bond price.


Volatility broke to a new Low as complacency seems to win over fear and markets are managing to run higher. My guess is we break out of this state of mind very abruptly but in timing we must be canny so I'd watch for a close above the Horizontal line.

Wednesday, September 8, 2010

Volatility is reaching support - Expect a RISE in Fear


Short term Volatility fund VXX is reaching a Support trendline. I expect Volatility to rise and this should mean fear will spread again.

Bonds are trading higher - Yields are easing


TLT has notably bounced off Gap Support line and TYX correspondingly is trading lower after reaching my notional target at 3.9% as I wrote a week ago. All is going okay in the New Normal...

Tuesday, September 7, 2010

Japanese Govt Bonds are correcting but running into Support

Yield is creeping higher inside the downtrend channel targeting 1.46%.

Weekly bond prices came off Overbought levels on the Weekly RSI however they are at a long term support level and will have to consolidate before the move resumes and certainly IF only the global re-flation is on the menu again.

Investment Cycle by John Paulson


This interesting piece was published and insightfully commented by ZERO HEDGE.
Here a link:

Tuesday, August 31, 2010

The rising Volatility in the Bond market signals a possible trend change

The Long Bond is trading inside a rising trend channel and bounced off the 13-Day MA Support on the last Friday Option Expiry as Tonbridge AL kindly reminded.
The COT Report however shows a possible change of hands as Commercials and Large Speculators are exchanging their exposure and that is a serious sign of caution. The trend has been strong but it always reaches a point where it bends and the rise in Volatility on last Friday is a sure sign of possible change.


10Y Note has similarly reversed the Friday volatility break but the COT Report here also shows that Commercials as swapping holdings with Large traders and we should remain cautions of the underlying moves.

Monday, August 30, 2010

30-Year Treasury Bond yield reverses with initial target at 3.9%


Bouncing off the lower channel trendline 30-Year Bond yield is targeting initially the Upper trendline resistance at 3.9%. RSI and ROC are indicating there is a reason for strong conviction in this trade, not to mention that the candle is qualified for a Key Reversal sign.

Friday, August 20, 2010

Japanese Government Bonds near their 20-year High

Japan 5-year CDS is making Higher Highs/Lows.


JGBs are drawing investors attention recently as they are close to 145 which was their 2003 High price. Monthly RSI is not even in Overbought condition so timing of a Short sell would be of a great importance since this market has been ranging for a full decade with no meaningful correction.

Kyle Bass from Hayman Advisors made a pile of money in the sub-prime crisis and he is now on the wires for his Short JGB position:

While deflationary pressure is building and everybody is starting again the bond bubble talk I'm pleased to observe a high momentum trend in bond prices and I believe it will be a nice educational experience to see how high it can go until it finally breaks. Then when inflationary cycle begins we will be ready to start building an equities allocation.

Thursday, August 19, 2010

SOFIX trend update


The major Bulgarian Stock Exchange Index - SOFIX bounced off 360 level of Support vigorously but I'd like to mention a few points of caution before we cheer the rise.

The chart clearly shows a series of Lower lows/highs and until this is changed it would be early to call a trend reversal.

400 level is a Major Pivot and a sentiment indicator as it clearly turned from Resistance into Support and now it would be again a serious test for the Bulls. Indicator-wise RSI is in deeply Overbought area and it is a sign of caution. If we see continuation of the upmove it might hang in there for a while but still we might see a powerful correction until 400 is decisively cleared and technical indicators are favorable for a Long position.

On the other side the Upmove is supported by the Trenline support coming off the Feb 2009 Lows and also price is hanging above the 100-Day MA, which however is pretty flat and it suggest we could just have a prolonged period of sideways consolidation.

Wednesday, August 18, 2010

TLT - Long-end Bonds are on a steep trend move

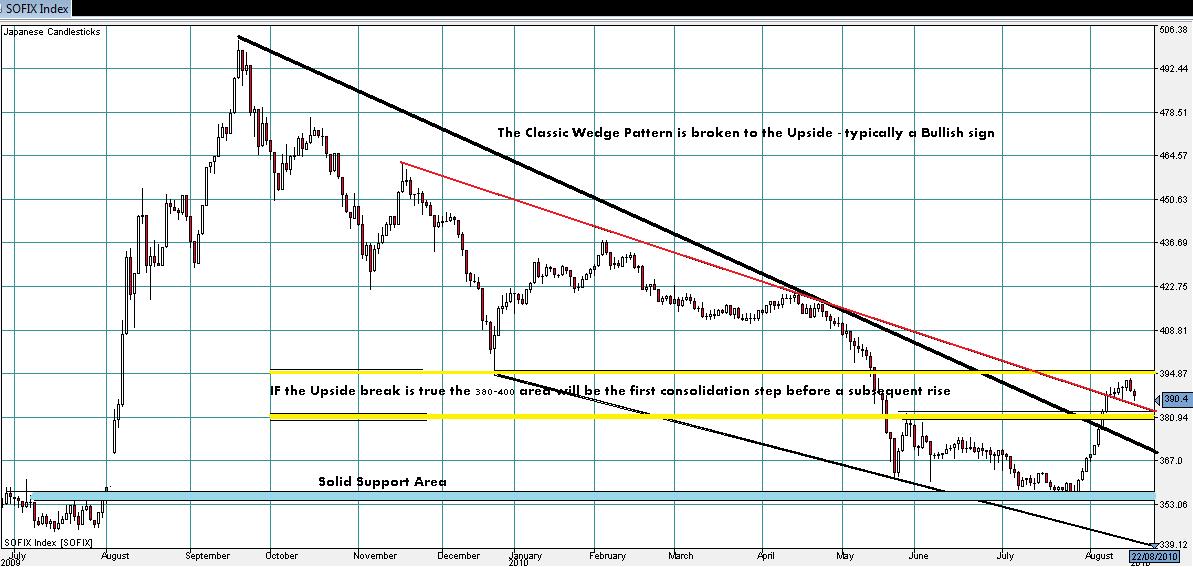
SOFIX breaks the Wedge pattern to the Upside

Following my last chart view of the major Bulgarian stock index - SOFIX from May 16, 2010:

I present an update on the market action.


Back then I wrote: "Technically the index is moving inside the Trend Channel which is the first Support at 398-399 is broken decisively with a close below will run into the Critical Support area at 360-344 where the Trendline support confluence is located. ... The important spot below 399 is the August 2009 Gap (360-380) which is begging to be filled by any textbook example. So the focus is if the confluence of the 344 support and the Trend channel bottom will provide the sufficient cushion for a reversal."

Indeed 360 level got tested 3 times and proved a hard Support from which stocks bounced for a swift rise into the 390-400 Resistance Area. The break to the Upside is shown as a breakout from a Falling Wedge pattern which is typically a strong Bullish sign. I expect however in the mid term some consolidation in the 380-400 area before the uptrend continues. Only a fall and close below 380 would turn on the bearish sentiment again.

Monday, August 16, 2010

Equities, Bonds, Commodities and FX Markets Update

EUR/USD found support above 1.27 at around 38.2% Fib (1.1860 - 1.3350) and is close to the Trendline support - a close below 1.27 confirms a trend reversal.

SPY broke heavily through the Trendline support and is leaking badly to the downside with first target around 105 which contained the trend in the previous test. A break lower would show high risk of making new lows and possibly reverting to new bear market.

TLT - Bond markets are creeping higher in a mighty trend style while long term yields are depressed and deflationary pressure is rising - FED's move into Quantitative Easing 2.0 is definitely in progress but seems there will be more pain until Inflationary theme kicks in - possibly 6 to 9 months if the first stimulus campaign and its results from March 2009 could be any guide.

GLD - Gold is trending higher again after the correction in July. We need to see 120 broken for a test of the all time highs. There are plenty of rumors and research on gold manipulation and price suppression however until deflationary pressure is cooled off I assume it's pretty normal for Gold to correct its price. On the other side John Paulson and David Einhorn which are high level hedge fund professionals have large allocations in GLD and physical Gold so I keep na eye on the trend strength.

Copper has been bullish despite the stock corrections. Its chart seems like a large swing graphic of the economic tides and its over sensitivity to the industrial activity. I expect it to go down until we have new stimulus measures from the global governments as it seems the first stage of the stimuli-induced growth is already losing strength and austerity measures are not of great help.

Crude Oil is near support as ween from the trend channel - I would expect however to see it lower as inflationary pressures are pretty far away and economic growth is not on the main list for the time being.


VXX the short term VIX fund is basing and creeping higher as stocks decline and markets are going back i to Risk OFF modus operandi. I expect VXX to rally along with the Bond market and the SPY decline since September is usually a pretty volatile month and it's time to shake off the complacency of the markets that has been ruling as of late.

Friday, July 30, 2010

GOLD Trend - 21&72 DMAs Dead Cross ahead of the 200 Resistance-Day MA


Volatility Breakouts usually signal trend reversal and so far we witness one in GOLD.

GOLD is developing a Falling Wedge pattern which has a Bullish implication if broken on the upside so I remain cautious in the meantime since we see a logical bounce off the important 1160 Support as marked on the chart. Lower stands 1140 Support area along with the 200-DMA at 1146 which is a very tough layer of Support to crack at least on the first attempt, IMHO.

I expect a retreat to 1200 Resistance first marked by the Trend line and the 21-Day MA.
The Bearish scenario is supported by the 21 & 72 - Day MAs Dead Cross, the sustained fall in the Rate of Change and the rise in the ADX reading above 26 which signal trend acceleration and at the moment the Trend is DOWN until proven otherwise.

Monday, July 12, 2010

GOLD Trend - Momentum is Fading


GOLD has been actively watched in the last months as it has been making new highs and touted as the ultimate Inflation protection vehicle. Inflation is not easy to find right now as several measures of the monetary velocity show a deflation threat is still intact and FED seems reluctant to signal end of QE with dismal Industrial Production data released a week ago.

Technically speaking GOLD tested the Trend line Support below 1200 and is now reaching a confluence of Resistance levels: the former Dec'09 Close and Open around 1216 and the 50-Day MA sitting on the same level. The Momentum since the May '10 top is fading and we could see how the Labored move failed with a volatility break which is a good signal of a possible Trend change. ADX has already given a Short signal.

Friday, July 2, 2010

US Treasuries 2y/10y Spread Flattening


The 2y/10y Spread has possibly reached a reversal point in its flattening move.

Interesting to watch are the 10-Year bond price to S&P correlation which might indicate more economic hardship ahead and equity weakness. The same is indicated by the 10-Year yield to the S&P.

Tuesday, June 29, 2010

Yield Curve Flattening - Bear Market looming

yield Curve Flattening has straight Bearish market implications.
It usually points to impending economic contraction and deflationary pressure - simply said Quantitative Easing 2.0 is coming.


Saturday, June 19, 2010

GOLD: 'Trend Is Your Friend'


Moving nicely inside the Up-Trend channel.
Note that the Commercials' and the Large Speculators' positions has been perfectly aligned for this trend continuation to run smoothly since the Lows in early 2004. It is important to note that Commercials are actually increasing their hedging short positions and close to the size when they first probed the 1248 High in late 2009. A basic view would be that they try to lock in as much volume at the present price levels as they are able to.

Interesting fact is that according to The World Gold Council the largest Gold Reserves holder is the US with 8 133 tonnes which represents 70.4% of its reserves.

This chart reminds every trend has an end where it bends. No way I would call it as we never know where a trend might end up especially as I wouldn't rule out a squeeze and a blow off top phase once the 1260 level is decisively taken out. Both RSI and Momentum show strength in the trend now and MAs are confirming the strong inertia the move has gathered. That's why as Physics laws rule we shouldn't go in the way of a body that has gathered such power along its motion course.
Now I mentioned the END as this Rising Wedge I have drawn is just an assumption and should be monitored for confirmation as it has strong Bearish implications. However I would look for a blow-off top first.